

Introduction
This white paper reports diesel engine oil analysis data demonstrating use of filtergram particle quantifier x-ray fluorescence (FPQ spectroscopy) to quantify severity of wear and contamination. Two independent measurements are performed on each filtergram specimen: pore blockage particle count and FPQ spectroscopic large particle elemental analysis. Causal inflections in ASTM D7720 cumulative distributions indicate severity thresholds for FPQ spectroscopic elemental analyses.
Key Points:
- Filtergram particle quantifier (FPQ) measures particle count and ISO code for particulate debris accumulated on a > 4-micron filtergram.
- FPQ spectroscopy reports elemental analysis of the particulate debris on each filtergram specimen.
- Wear and contamination severity determination based on particle count and elemental analysis of greater than 4-micron debris including Fe, Cr, Ni, Cu, Sn, Pb, Al, and Si.
- Filtergram specimens retain wear debris if needed for future reference, defect elimination, and root cause failure analysis (RFCA).
Worldwide engine oil analysis extensively uses optical emission spectroscopy (OES) to measure Fe, Cr, Ni, Cu, Pb, Sn, and Si to quantify abnormal wear and contamination. However, the molecular to ultra-fine particle size limitation for OES obscures its effectiveness for distinguishing abnormal component wear and engine oil dust contamination for these: 1) there are numerous molecular-to-micron size range normal or benign sources of these seven elements, and 2) severe wear and dust contamination debris are typically larger than the OES particulate measurement range.
OES measurement range detects all seven of these elements in engine oil originating from many sources. For example, “rising copper concentration can reach well over 300 ppm. As alarming as this sounds, it has been reported that copper sulfide, even in these high concentrations, is generally benign and as such may not be associated with (cause or effect) cooler failure, accelerated wear or lubricant oxidation. Copper found in diesel engine oils can come from wide-ranging sources and can exist in the oil in varying states. From the oil analyst’s perspective, determining the source, nature, and state of copper is essential to correctly interpreting the alarm in terms of engine reliability and the appropriate response. Although very valuable, [OES] elemental analysis has limited capability and, in fact, may produce false alarms or mask real alarms unless other tests are performed concurrently or on an exception basis.”1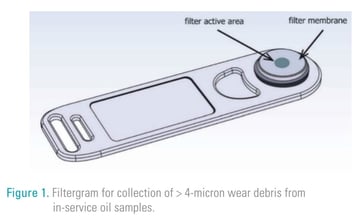
The FPQ spectroscopy performs pore blockage particle counting followed by energy dispersive X-ray fluorescence multi-elemental analysis per ASTM D7684, ASTM D8127, and ISO 21018-3. Figures 1 and 2 show the filtergram particle quantifier (FPQ) having an active area portion of the 4-micron filter membrane where wear debris accumulates. The FPQ specimen is labeled, FPQ elemental analysis is performed, and the specimen is retained for future visual and microscopic examination.
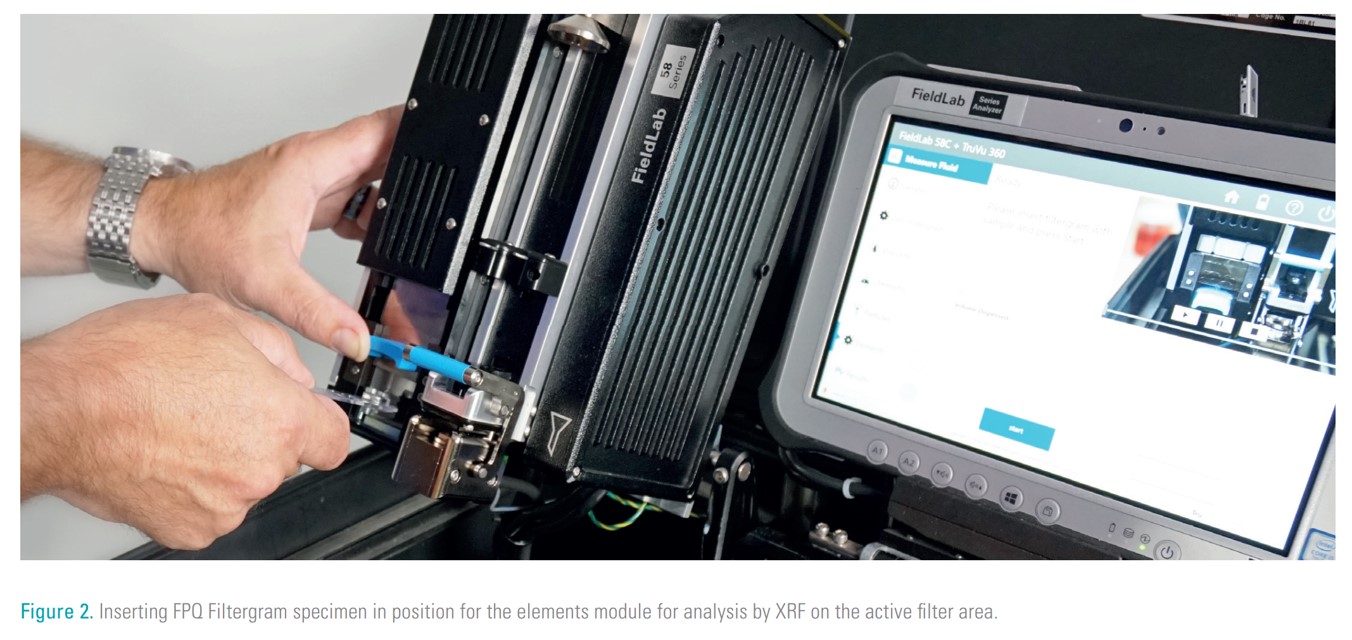
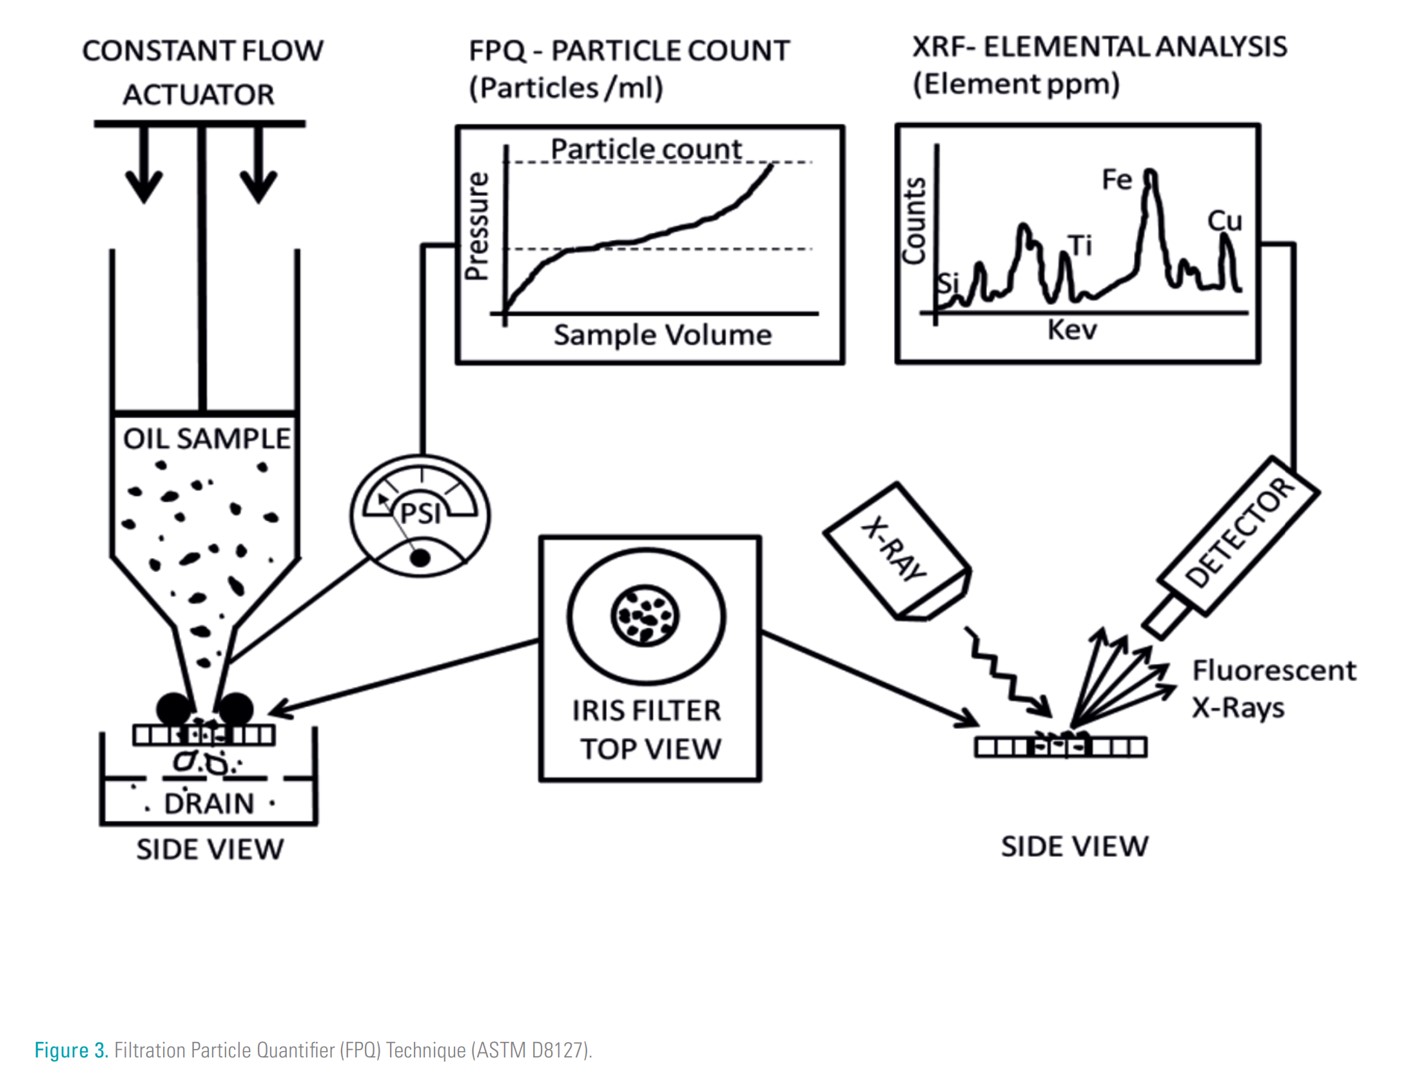
Figure 3 illustrates the two-step process involved in extracting >4 micron particulates from in-service oil samples and analyzing the elemental composition of the debris collected on the filter's active area.
Advantages of this 2-step process include:
-
Fast, Solvent-Free Method:
- No need for dilution or acid digestion sample preparation.
- Suitable for field conditions.
- Offers a repeatable, consistent particle presentation with a measured volume for PPM concentration calculation.
-
Powerful Data for Advanced Wear Detection:
- Provides results for particle count measurement.
- Non-destructive FPQ test reports 16 elements in parts per million (PPM): Fe, Ag, Al, Cr, Cu, Ni, Pb, Si, Sn, Ti, Mo, Co, Mg, W, V & Zn.
- Retains the specimen with debris for future investigation.
- Correlates with other techniques used for analyzing large particles.
Severe Wear Debris
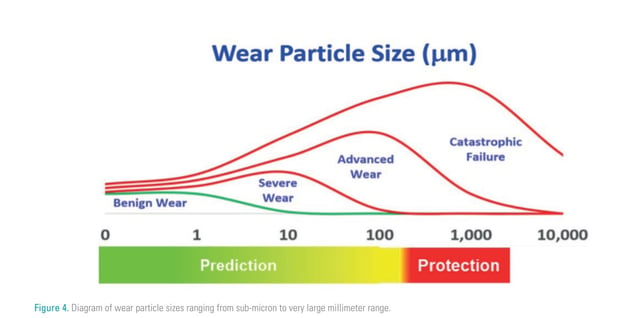
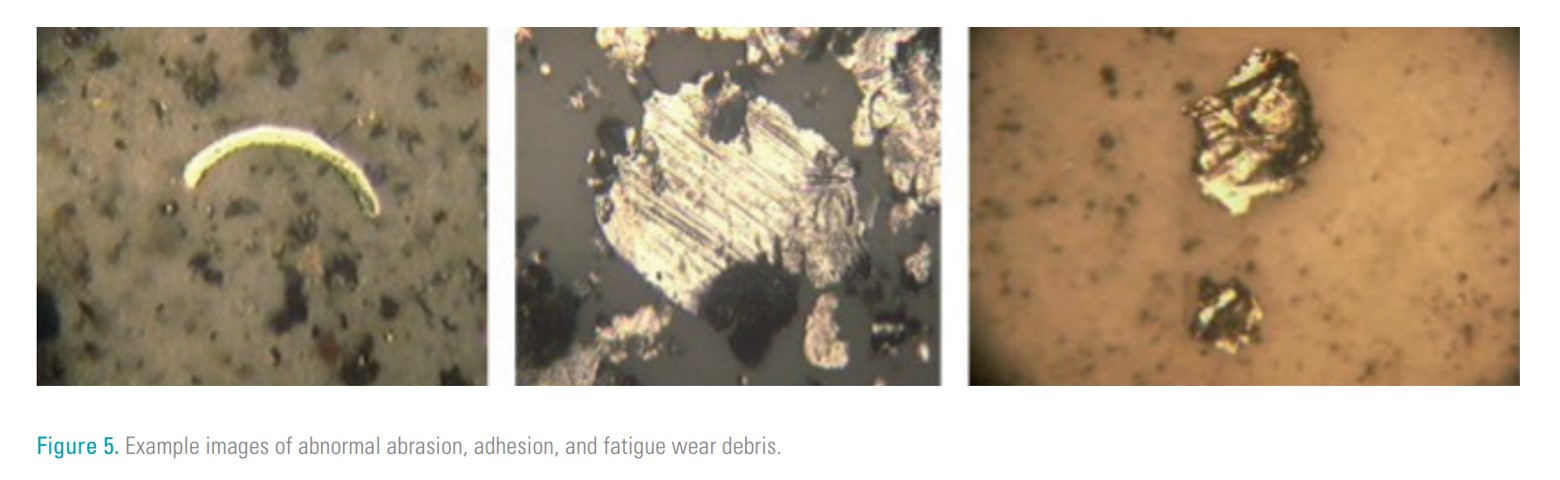
Severe sliding, rolling fatigue, and bending fatigue are failure mechanisms that exponentially shorten the functional life of machine components. Damage from each mechanism is cumulative and progressive. Wear debris from each of these mechanisms carries evidence about the damaged component, the result causing damage, and the stage or severity of failure progression. Benign severe, advanced, and catastrophic wear presented in Figure 4 represent increasing severity levels. Abnormal abrasion, adhesion, and fatigue (Figure 5) comprise of large wear particles, not just metal oxides.
- Microspall particles range between 10 microns and 50 microns.
- Laminar particles and chunks range from 50 microns to several hundreds of microns.
- Optical emission spectroscopy is blind to large particles.
Filtergram particle quantifier (FPQ) measures particle count and ISO code for solid particulate debris accumulated on a > 4-micron filtergram which includes the important stages of severe wear and advanced wear leading to catastrophic period after failure, wear debris size ranges are shown on Figure 4. Notice that the range for prediction of impending catastrophic failure requires measuring wear debris in the OES blind spot range from 4-micron to 2-millimeter size range.
Severity limits for FPQ XRF and OES data in this report
A population of 52 in-service engine oil samples is tested using filtergram FPQ and also with OES.
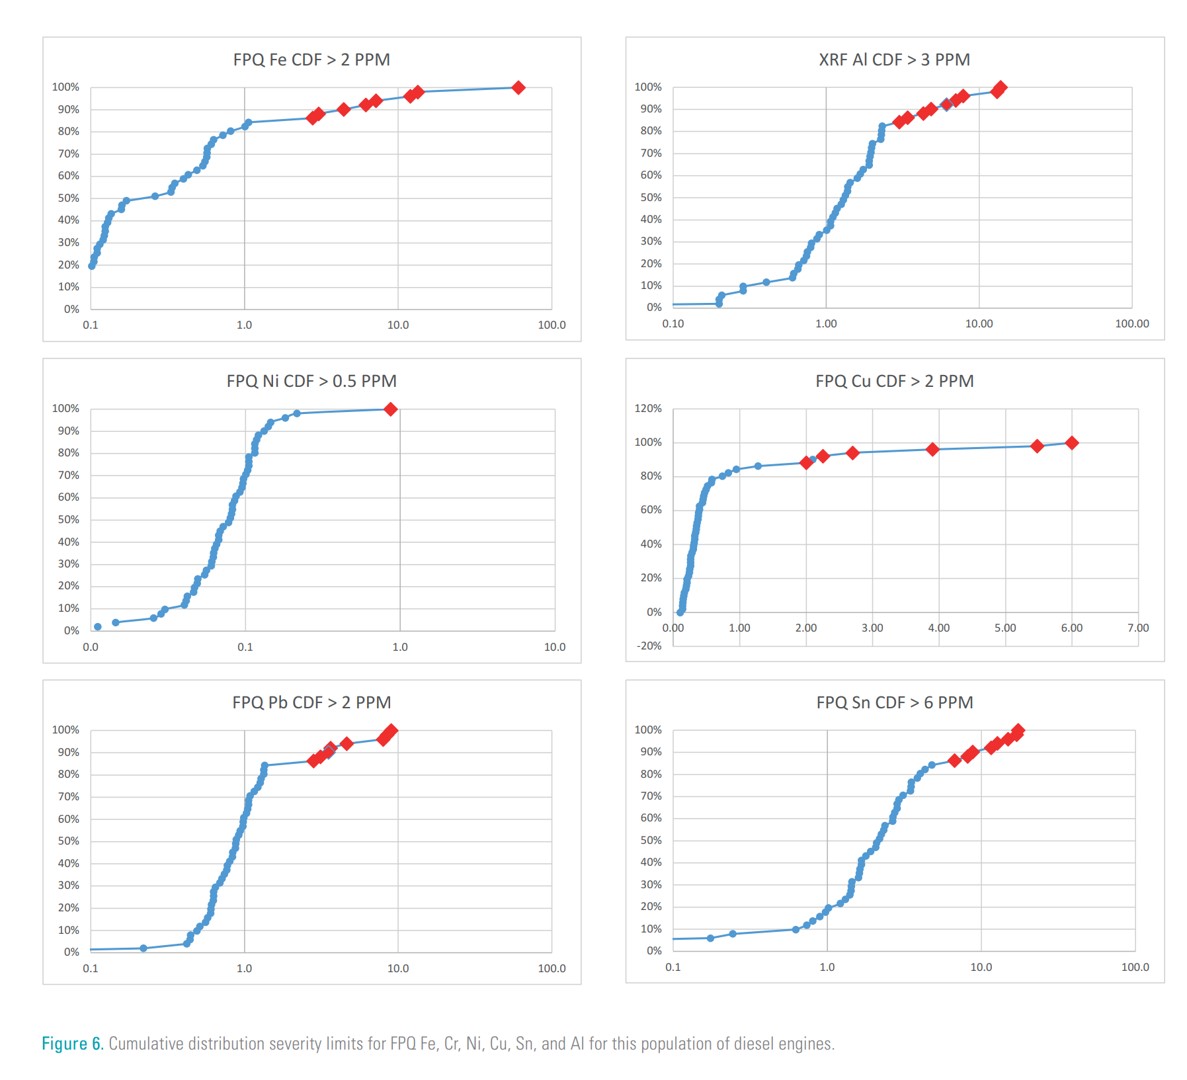
ASTM D7720 cumulative distributions shown in Figure 6 are used to select preliminary severity limits.
Preliminary FPQ spectroscopic severity limits for Fe, Cr, and Ni quantify abnormal wear from cylinders, piston rings, gears, shafts, timing wheels, timing chains, valve tappets, guides, crankshaft, camshaft, rocker arm shaft, piston pins, roller bearings, and oil pump.
Furthermore, preliminary FPQ spectroscopic severity limits for Cu, Sn, Pb, and Al quantify running surfaces of connecting-rod bearings, rocker arm shaft, and piston pin bearings; and Si quantifies air intake dust.
OES severity limits used in this report are accepted OES industry standard alarm limits.
Root Cause Failure Analysis
Analytical Ferrography (AF), Rotrode Filter Spectroscopy (RFS), Scanning Electron Microscopy (SEM), and acid digestion are the standard methods for in-service oil analysis of ferrous and non-ferrous wear debris in the OES blind spot (> 4-micron to 2-millimeter range). Occasionally, one of these time-consuming methods is used with special justification such as for root cause failure analysis (RFCA).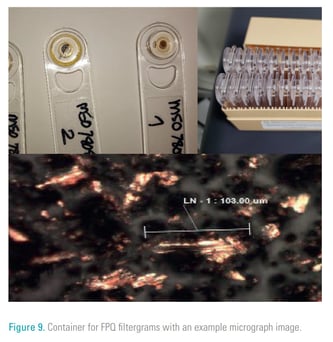
Filtergram specimens (see Figure 9) are retained and available for:
- Retest and comparison.
- Microscopic wear debris analysis.
- Future investigation.
- Case history example.
- Defect elimination.
Conclusion
Preliminary FPQ spectroscopic severity limits for Fe, Cr, and Ni quantify abnormal wear from cylinders, piston rings, gears, shafts, timing wheels, timing chains, valve tappets, guides, crankshaft, camshaft, rocker arm shaft, piston pins, roller bearings, and oil pump.
Furthermore, preliminary FPQ severity limits for Cu, Sn, Pb, and Al quantify running surfaces of connecting-rod bearings, rocker arm shaft and piston pin bearings; and Si quantifies air intake dust.
FPQ filtergram specimens may be retained and available for retest, future reference, defect elimination and root cause failure analysis (RCFA)

