

 Rotating Disc Electrode Optical Emission Spectroscopy (RDE-OES)
Spectrometers that look at the multitude of spectral lines from a heated , or “excited,” sample are called optical emission spectrometers. All optical emission spectrometers consist of three main components.
1. Excitation Source – introduces energy to the sample.
2. Optical System – separates and resolves the resulting emission from that excitation into its component wavelengths.
3. Readout System – detects and measures the light that has been separated into its component wavelengths by the optical system and presents this information to the operator in a usable fashion.
One typical method used in the excitation source in modern spectrometers is an electric discharge. The source is designed to impart the energy generated in an arc, or spark, to the sample. For oil analysis spectrometers, a large electric potential is set up between a disc and rod electrode with the oil sample in the gap between them. An electric charge stored by a capacitor is discharged across this gap creating a high temperature electric arc, which vaporizes a portion of the sample, forming a plasma. A plasma is a hot, highly ionized gas which emits intense light. The light given off as a result of this process contains emissions from all the elements present in the sample. These emissions
can now be separated into individual wavelengths and measured using a properly designed optical system. Temperatures in the 5000 to 6000°C range are achieved and even difficult to excite elements emit enough light to be readily detected.
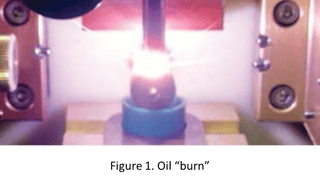
Since the early days of spectroscopic oil analysis, oil has been sparked, or “burned,” between a rotating carbon disc electrode and a carbon rod electrode. The sample is placed in a sample cap, the disc is partially immersed in the oil sample and the disc rotates as the burn proceeds (Figure 1). This requires about 2 or 3 ml of sample, depending on the exact cap being used.
A fresh disc and a newly sharpened rod are required for each sample to eliminate sample carryover. This method is called rotating disc electrode (RDE) optical emission spectroscopy (OES), or combining the two, RDE-OES. Alternatively, it is referred to as RDE-AES, which stands for rotating disc electrode atomic emission spectroscopy. The light coming from the plasma is separated by the optical system, in a spectrometer, into the discrete wavelengths that comprise it. An optical device called a diffraction grating, is used to separate the discreet wavelengths. The diffraction grating is a concave mirror with very fine lines on its surface that causes incident polychromatic light to be separated into component wavelengths and focused on an array of light detectors.
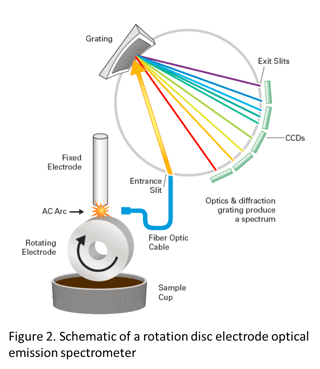 Figure 2 shows the major components of an oil analysis spectrometer using a polychromator optic, based on the Rowland Circle concept. Light from the excitation process, or the “burn,” exits the fiber optic cable and passes through the entrance slit, where it is concentrated on the diffraction grating by a lens. The entrance slit introduces light made up of all the elements present in the oil sample and defines the shape of the spectral lines at the focal curve after it is diffracted by the grating. The purpose of the grating is to separate, or “diffract,” this light into its component wavelengths. The spectral lines can be photographed or electronically quantified by photomultiplier tubes (PMTs) or charge coupled devices (CCDs).
The readout system of a spectrometer is typically controlled by an industrial grade processor and software. A clocking circuit and amplifier periodically read the charge on a Photo Multiplier Tube, or CCD chip, and convert it from an analog to a digital (ADC) signal to measure the light that has fallen on a pixel. The charge
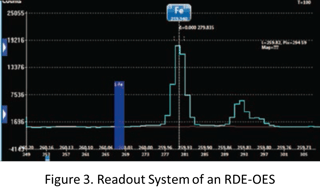 accumulated on a pixel is converted to an arbitrary number defined as “intensity” units. At the end of the analysis, the total intensities for each element are compared to calibration curves stored in memory, and are converted to the concentration of the element present in the sample (Figure 3). Concentration is usually expressed in parts per million (ppm). This information can either be displayed on a video screen, or printed. Once the analysis is completed and the results are recorded, the system is ready for the next analysis. The analysis results may be left on the screen, stored on the hard disk, or sent to an external computer.
SpectrOil Family of Spectrometers: The Market Leading RDE Spectrometers
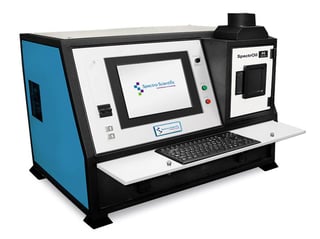
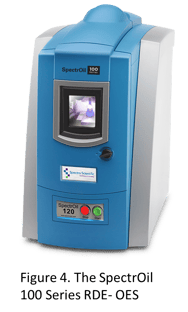 RDE-OES spectrometers for used oil analysis continue to be the choice for elemental measurement. It has been more than 50 years since the technology was first used by railways and the military because of the instrument’s ruggedness, reliability, and stability. Research and development continues with the technique, with major improvements in limits of detection, and long term stability, a result of new electronic hardware, software and optics. The latest innovations in these areas are incorporated into the SpectrOil 100 Series spectrometer, shown in Figure 4. This system has a very small footprint, and is easier to use than ever before, making it the solution of choice for lubricant, coolant, and on-site fuel labs within mining, power generation, and commercial laboratories. The SpectrOil is available in a variety of application specific configurations shown in the Table below.
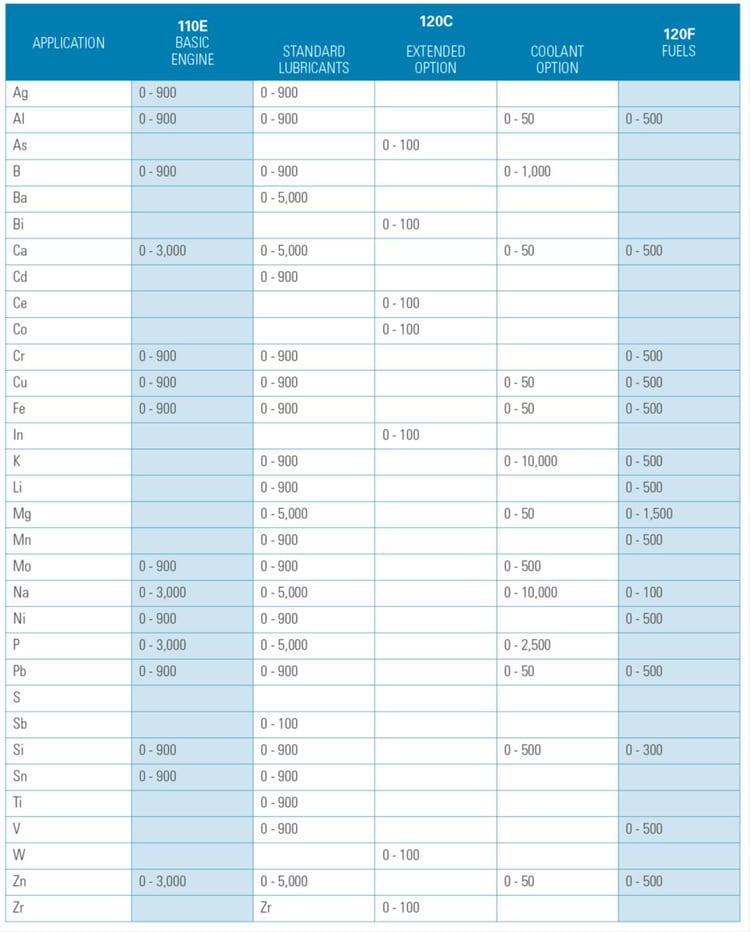
 The SpectrOil M is a rugged and transportable system primarily used for military applications as specified by the DoD JOAP program. SpectrOil 110E is tailored to the specific requirements of engine monitoring, while the SpectrOil 120C fulfills the requirements of ASTM D6595, and is the default option for commercial customers. The SpectrOil 120F for fuel analysis meets the requirements for ASTM D6728, and an additional L/D program is available to meet the specific low vanadium and alkali element limits required by GE Power systems gas turbines, per the GE- MTDTD- 002 specification. These systems are also used for coolant analysis and washdown water analysis.
